LOUIS PHILIPPE × OPTIPHOENIX: QUICK FILTERS ON THE PRODUCT LISTING PAGE DROVE A 15.15% CONVERSION RATE UPLIFT
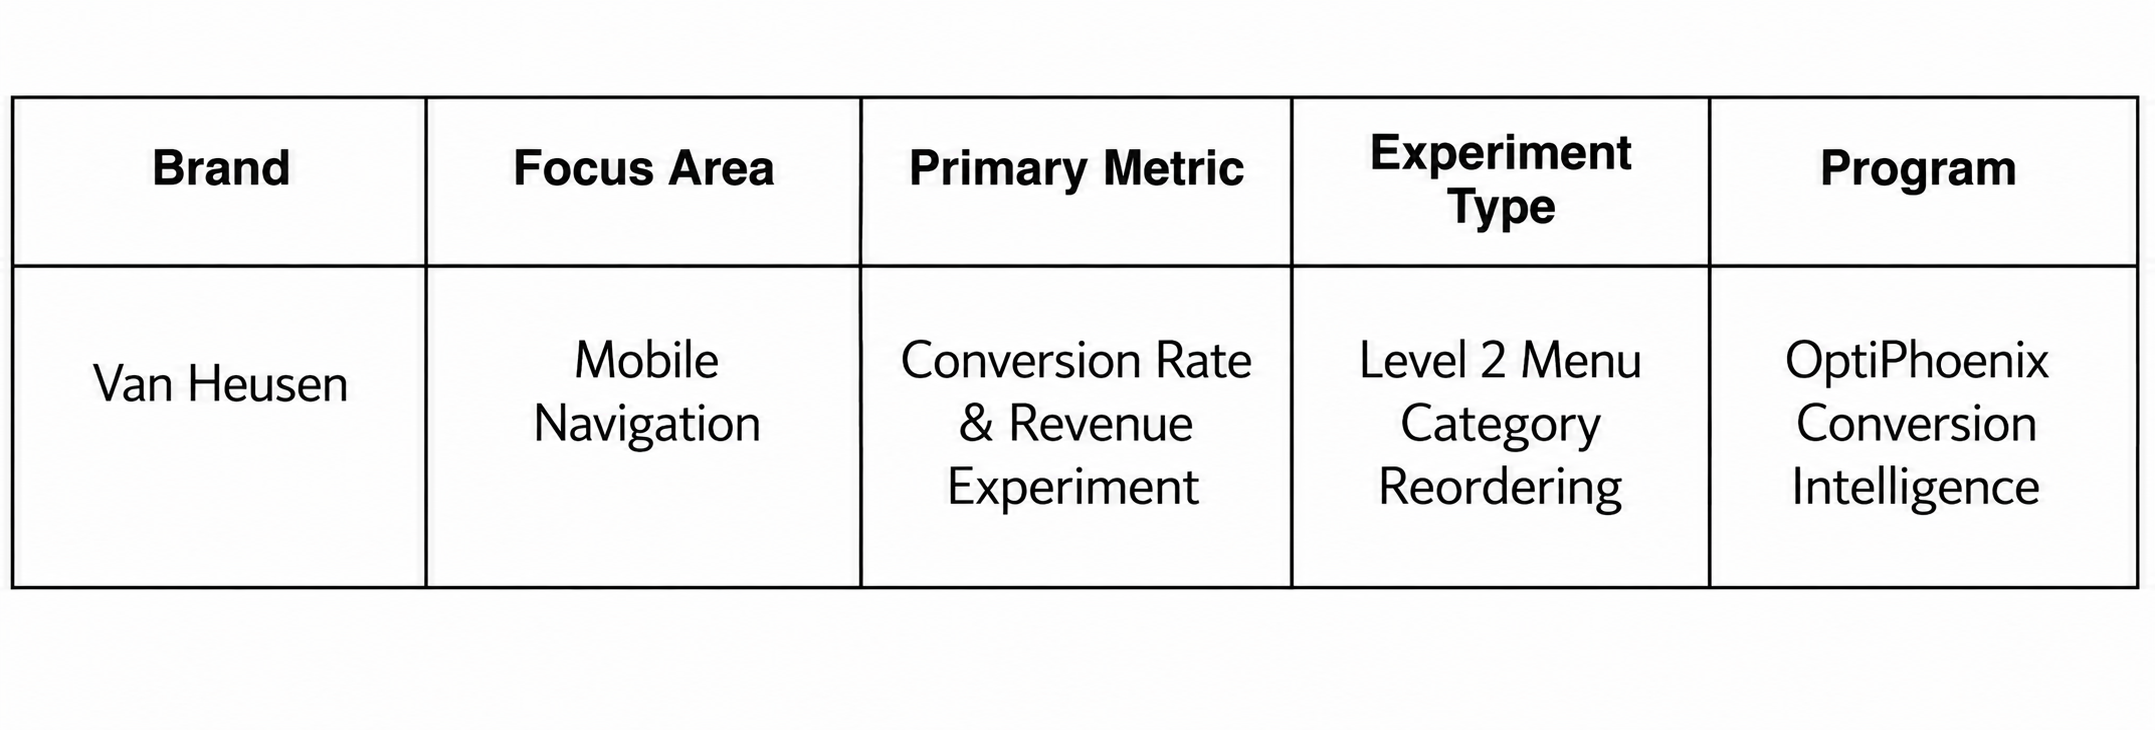
Van Heusen is one of the brands available through the ABFRL SuperApp, a unified fashion shopping platform that brings together brands including The Collective, Louis Philippe, Van Heusen, Allen Solly, Peter England, Pantaloons, American Eagle, and Forever 21 into one shopping experience. On Van Heusen’s mobile navigation, the Men and Women Level 2 categories appeared in a fixed sequence that did not reflect how customers actually shopped. Popular, high-converting categories often sat lower in the menu, which meant users had to scroll further before reaching the categories they were most likely to buy from.

OptiPhoenix partnered with Van Heusen to test whether reordering the menu around actual purchase behavior would reduce that friction and improve conversion.
The categories customers wanted most were in the menu. They just were not near the top of it.
A fixed menu order treats every category as equally likely to be shopped, even when purchase data shows otherwise. When a high-converting category sits several scrolls down, users who would have gone straight to it instead spend extra effort searching, or give up before finding it. The gap sat between what customers were actually buying and where the menu assumed they would look.
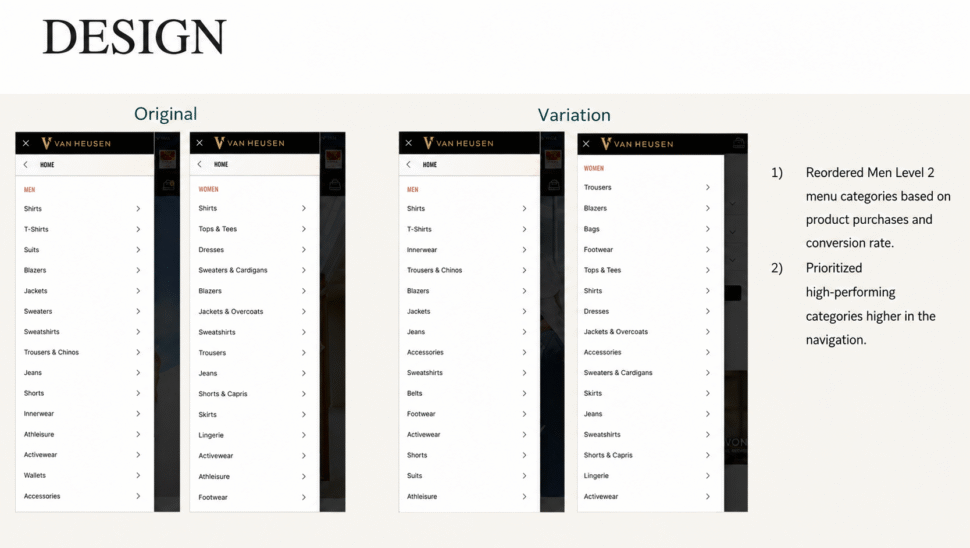
OptiPhoenix proposed that reordering the Men and Women Level 2 menu categories based on purchase volume and conversion rate, surfacing high-performing categories higher in the navigation, would let users discover relevant products faster and drive a higher conversion rate.

OptiPhoenix ran a controlled A/B test on Van Heusen’s mobile navigation.
Variant A (Control): The original menu, with Men and Women Level 2 categories displayed in a fixed sequence unrelated to purchase behavior.
Variant B (Test): The Men Level 2 menu categories reordered based on product purchases and conversion rate, with high-performing categories prioritized higher in the navigation.
Metrics measured: Conversion Rate, Revenue and order volume by category.
Matching the menu order to actual purchase behavior moved more users toward a purchase.
Conversion Rate rose from 1.40% to 1.64%, a 17.15% increase, reaching 95.23% statistical significance. Revenue rose 25.84% over the same test. Orders in the Men’s category rose 46.15%, while orders in the Women’s category rose 6%.
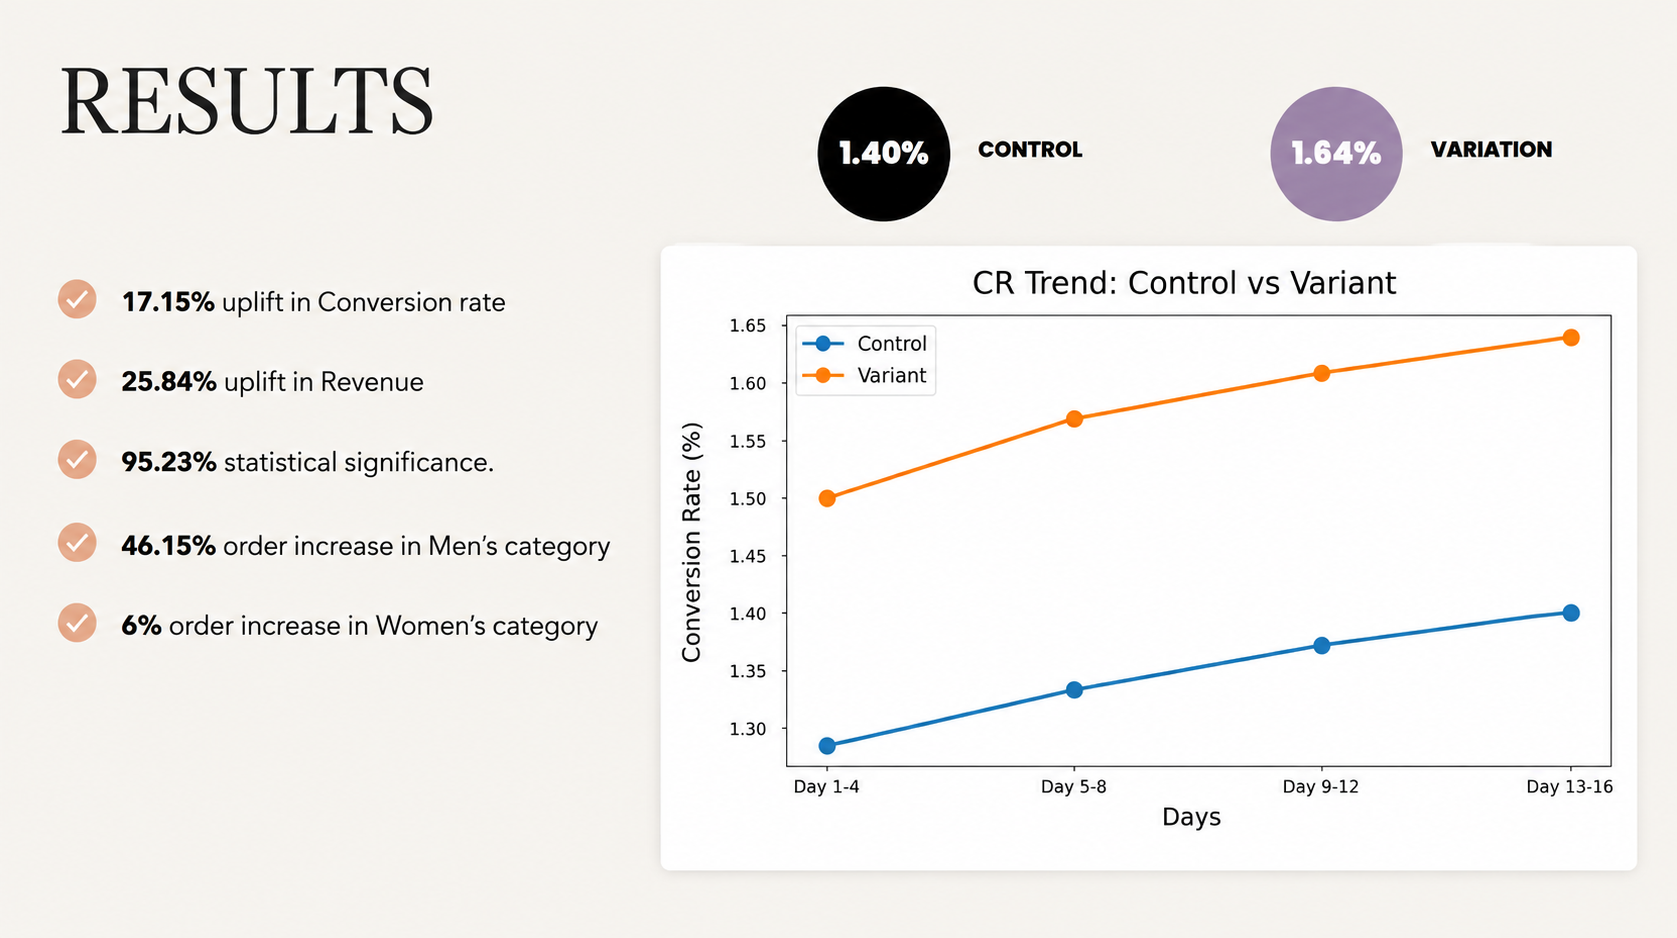
Menu order is a discovery decision, not just a layout choice. Categories placed lower in a fixed menu lose visibility regardless of how well they convert, which is why aligning order with purchase data changed behavior directly.
The gains were not evenly distributed, and that is useful information. The 46.15% jump in Men’s category orders far outpaced the 6% increase in Women’s, showing where the original menu order was creating the most friction and where future reordering could focus next.
Behavioral data should inform structure, not just content. This test did not add new categories or change any product information. It only reordered what already existed, based on how customers already shopped, and that was enough to move both conversion and revenue.
Van Heusen’s customers were not failing to find what they wanted because it was missing from the menu. They were failing because the menu was not organized around how they actually shopped. By reordering categories to match real purchase behavior, OptiPhoenix closed that gap, and the categories customers wanted most became the categories they saw first.